
A joint gamma-ray and neutrino analysis with CTA and KM3NeT
Added: January 23, 2024.
Like CTA is for gamma-ray astronomy, KM3NeT is a major upcoming observatory for neutrino astronomy. In a new study appearing in the European Physical Journal C, I have demonstrated with collaborators how one can jointly analyse data from these two facilities in a consistent manner.
The motivation for combining gamma-ray and neutrino data becomes clear when considering that these particles are produced simultaneously in many astrophysical environments. In fact, whereever cosmic-ray nuclei are accelerated to very high energies, one expects joint production of gamma rays and neutrinos. They arise from the decay of pions (and other particles) that are created when the cosmic rays undergo interactions with gas, we call this the “pion decay” (PD) scenario. Gamma rays can also be produced in another way though, namely from accelerated electrons in a process called “inverse-Compton” (IC) scattering. Crucially, no neutrinos are created in this scenario.
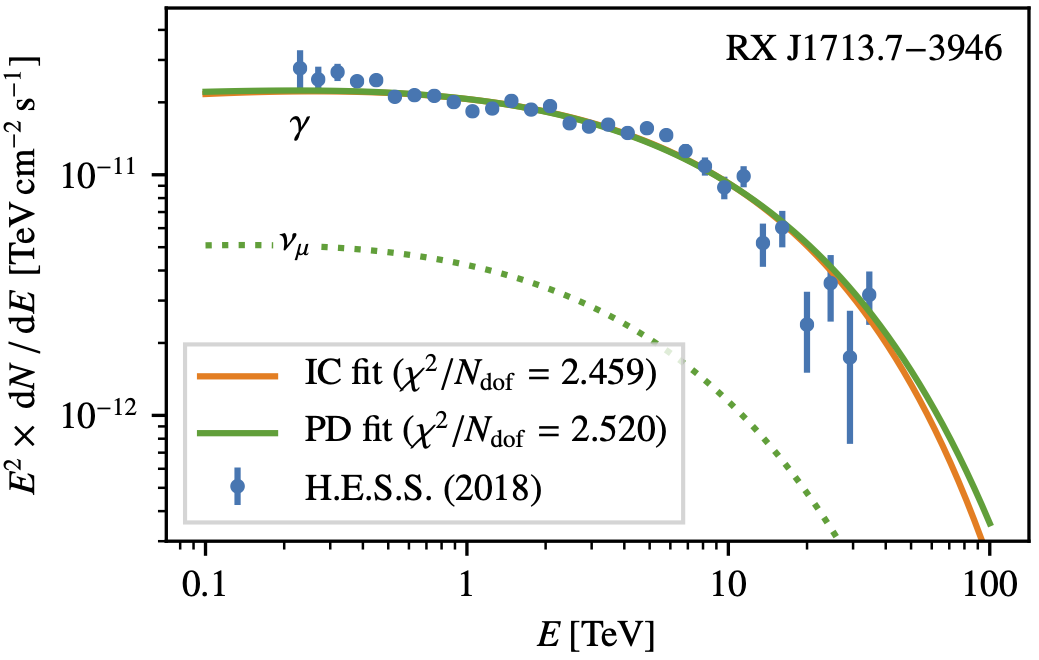
In our study, we have investigated how one can distinguish between these two scenarios (PD/IC), using several Galactic gamma-ray sources as example. To do this, we have first fitted spectral models for both scenarios to published gamma-ray flux measurements. The plot on the right shows this for the supernova remnant RX J1713.7–3946. Evidently, both models give a decent description of the measured flux points, which already illustrates that it is difficult to distinguish between the PD and IC scenarios with gamma-ray data alone.
With “instrument response functions”, which need to be derived from simulations, one can compute how a source corresponding to the fitted models would look like in the CTA and KM3NeT detectors. We did this for both scenarios and all sources, generating 100 randomised “pseudo experiments” for each case. We assumed 10 years of detector operation for KM3NeT, and an observation time of 200 hours for each source with CTA.
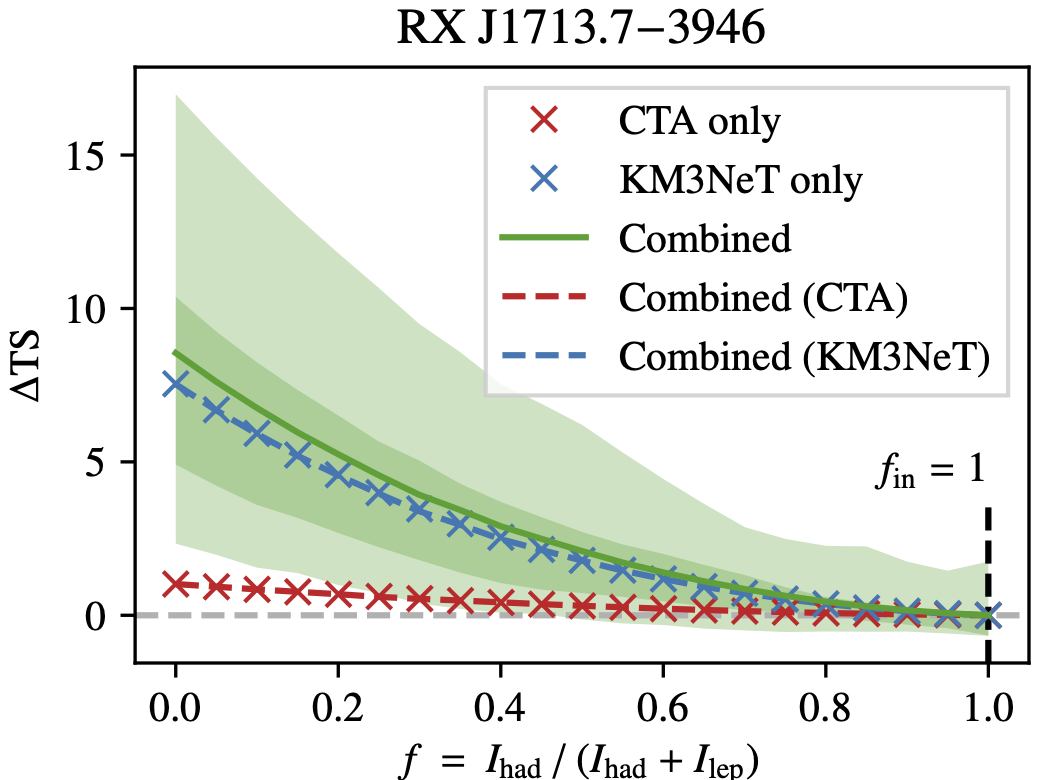
We then analysed these data sets using a combined likelihood analysis to constrain the “hadronic fraction” f, which is the fraction of the total gamma-ray emission that is due to the PD process. This is shown on the left, again for RX J1713.7–3946, where the input scenario corresponds to f=1, that is, a pure PD scenario. The quantity on the y-axis, ΔTS, indicates the confidence with which we can reject a certain fraction f. As intuitively makes sense, the green curve – the result from our combined analysis – increases as this fraction deviates more and more from the input. The green bands show the statistical spread: among our 100 simulated experiments, by chance some can differentiate between the scenarios better and some worse.
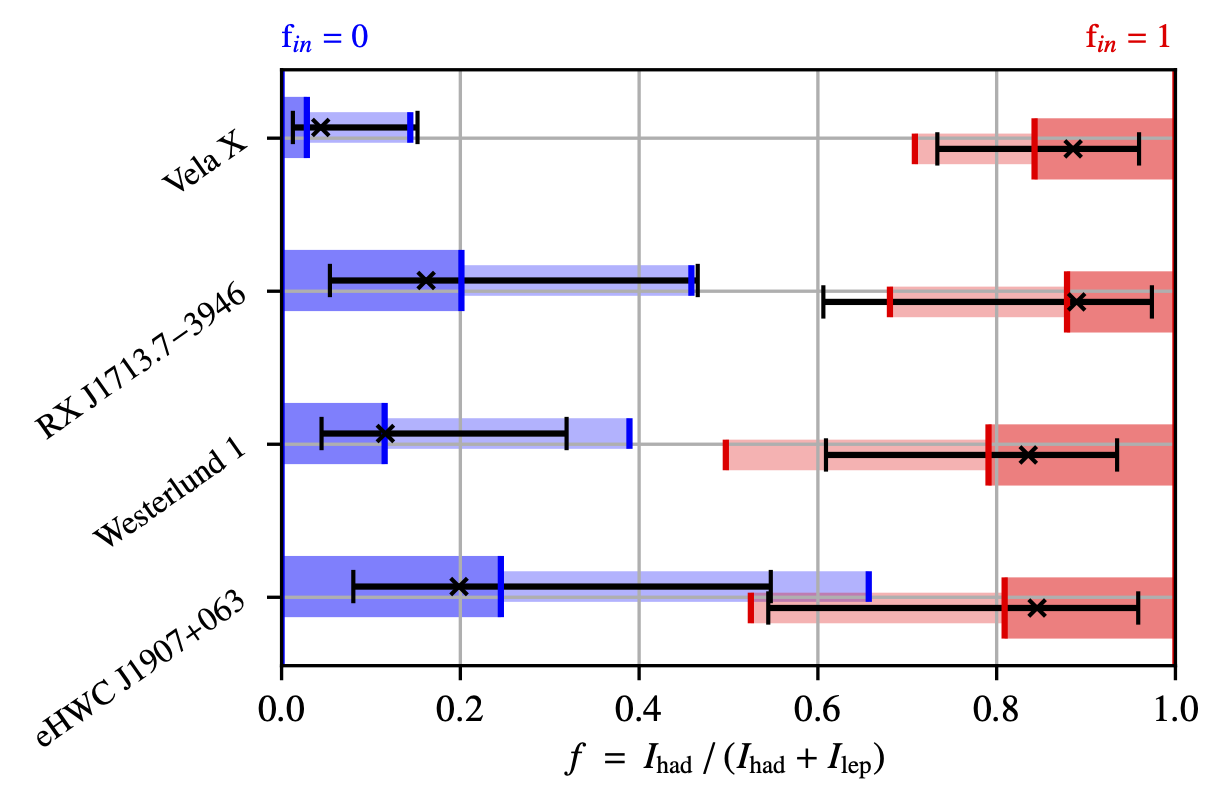
Finally, the plot on the right summarises the results we obtained, for all the sources we tested. The blue and red bands show how the fractions f we obtain in the 100 pseudo experiments are distributed: 68% of the values fall within the broad band, and 90% within the narrow band. The black intervals on the other hand display an average of the “credible intervals” that we derive from the likelihood analysis for each pseudo experiment. The smaller these intervals, the better we can constrain the hadronic fraction f for this source.
Paper reference: European Physical Journal C 84, 112 (2024)
DOI: 10.1140/epjc/s10052-023-12279-z
Pre-print: arXiv:2309.03007